
In the case of interaction design, the following keywords are associated with this Design Domain 2018.
– ‘Where do we live?’ – Virtual communities, social media, networks, Mapping/ borders, Privacy.
– ‘What do we look like?’ – Embodiment, Surveillance, Tracking, Facial Recognition, Uncanny Valley, Perception, Computer Vision.
– ‘Why do we imagine?’ – Machine learning, futuristic novels, virtual, nonlinear descriptions, narratives, and myths.
– ‘Who are we?’ – Online personas, Authorship, Citizenship, Autonomy, Post-Factual, Post – Truth.
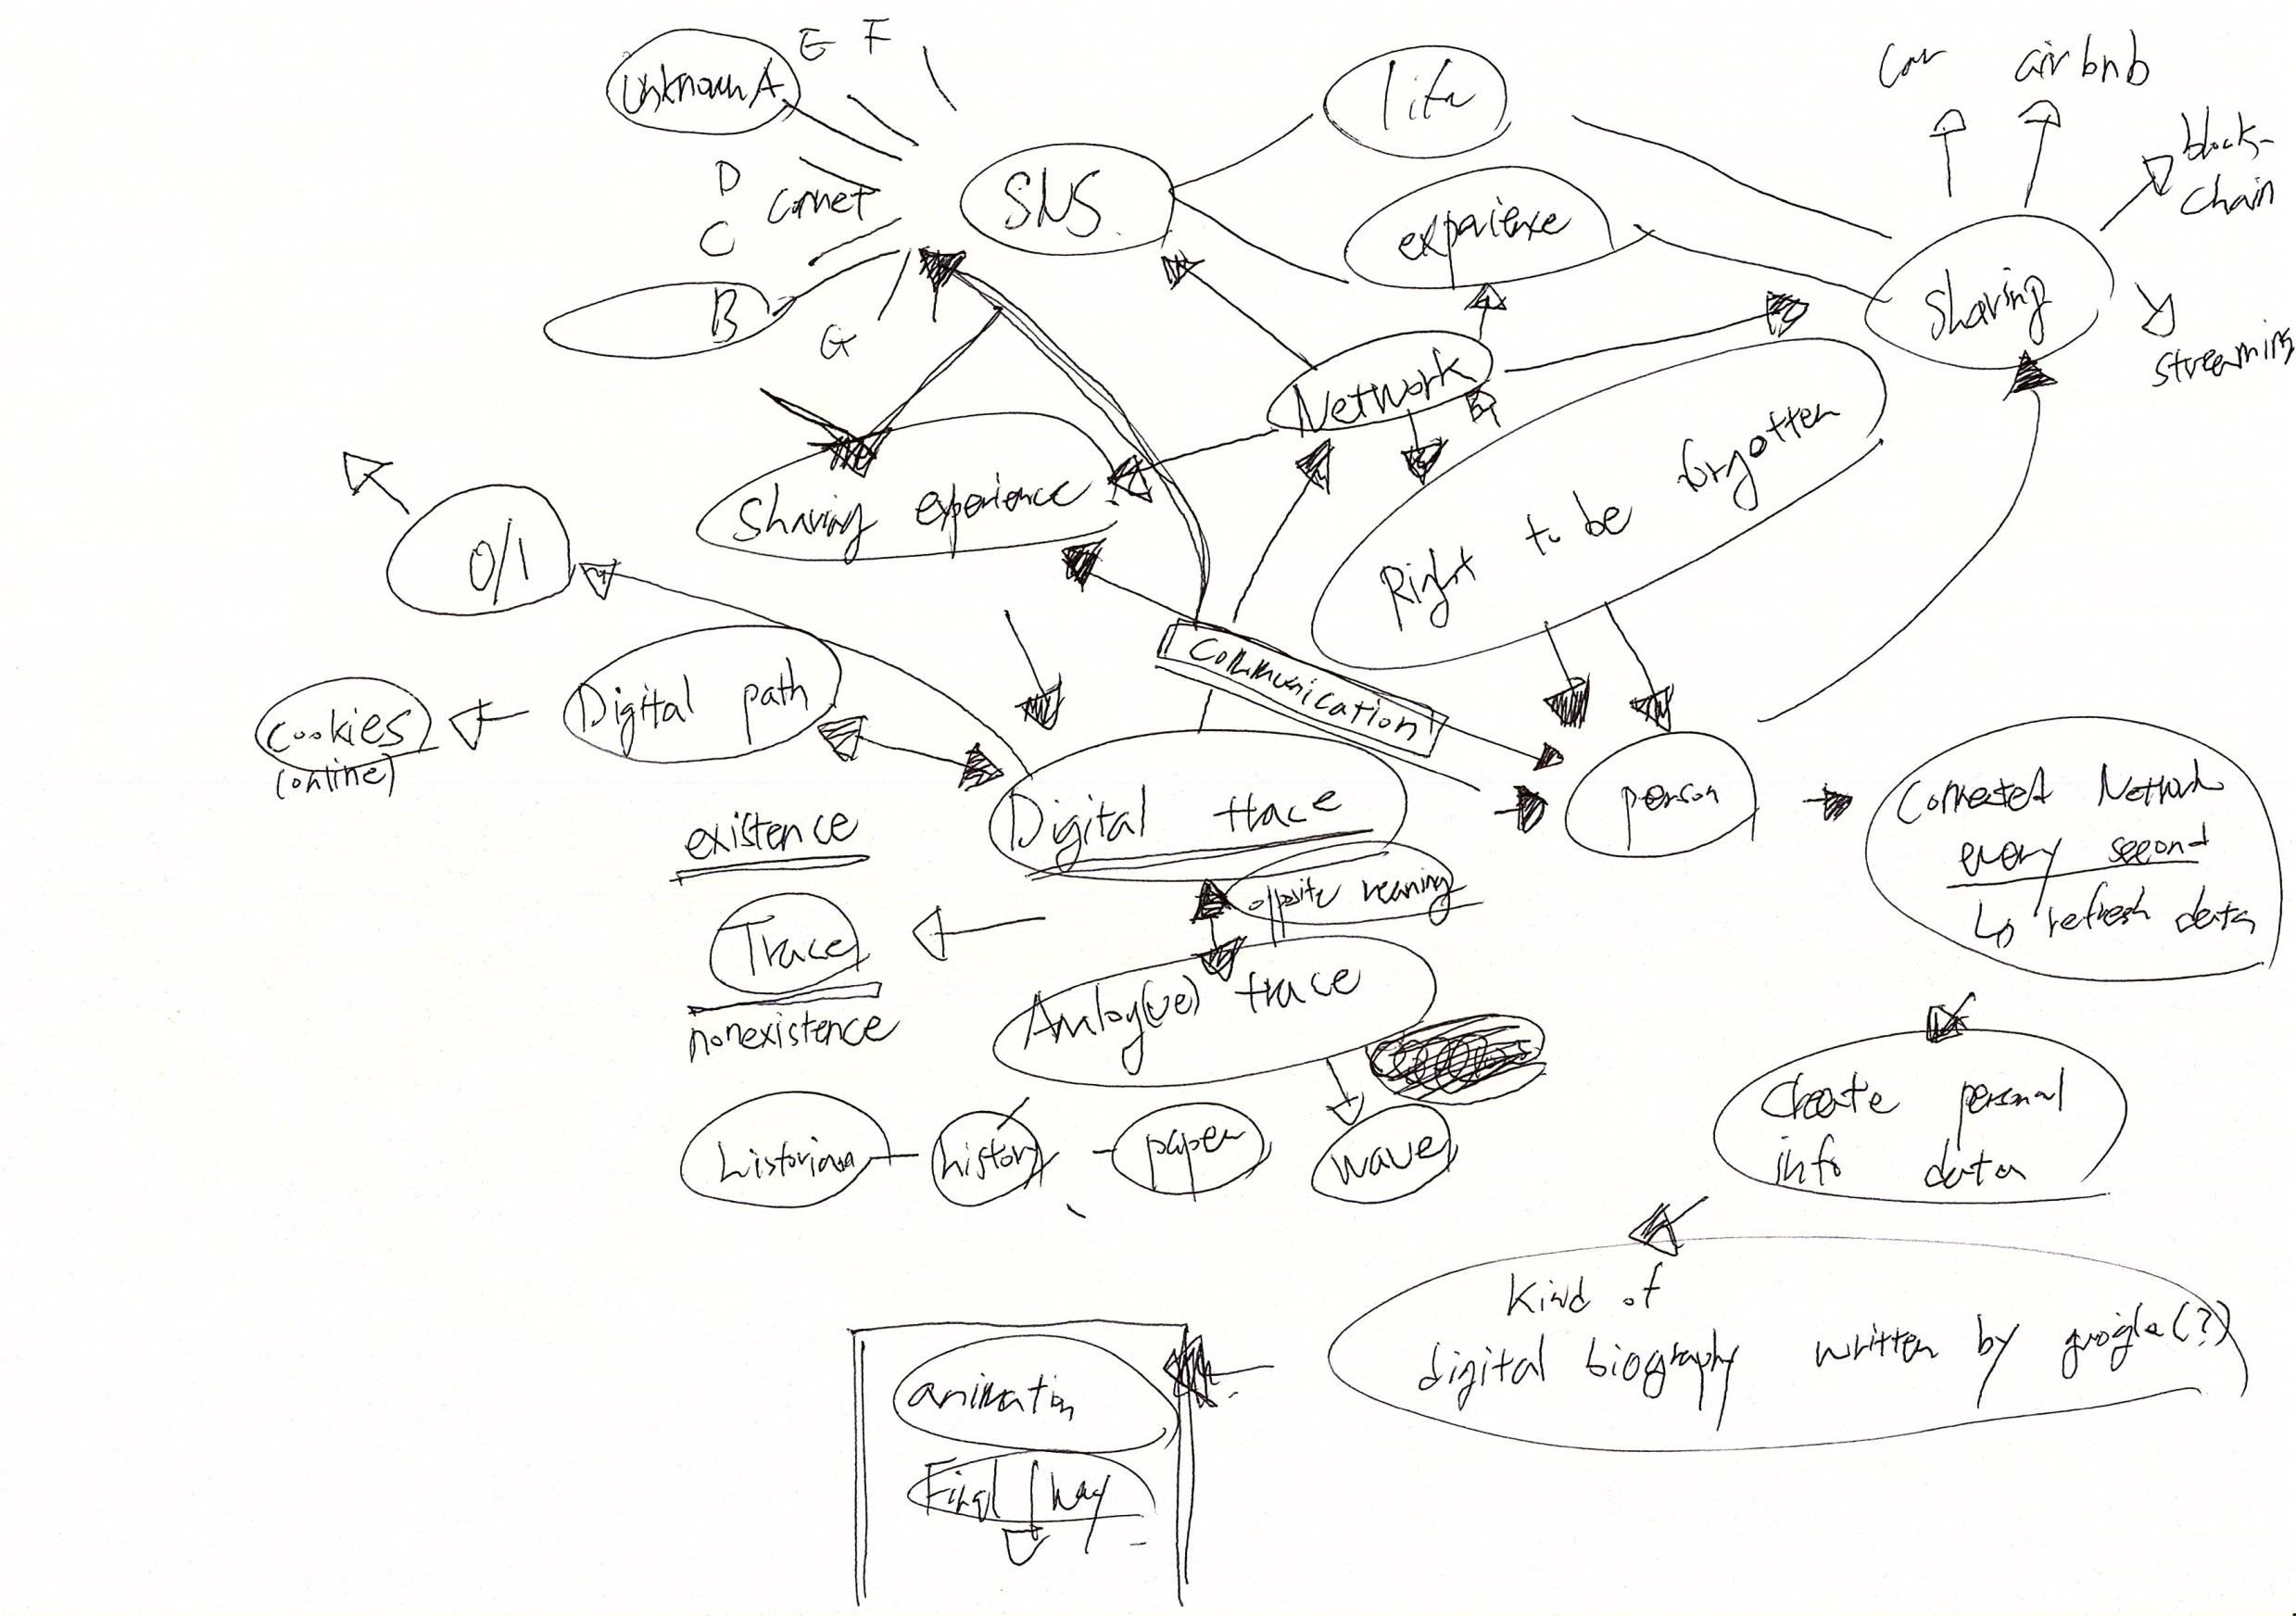
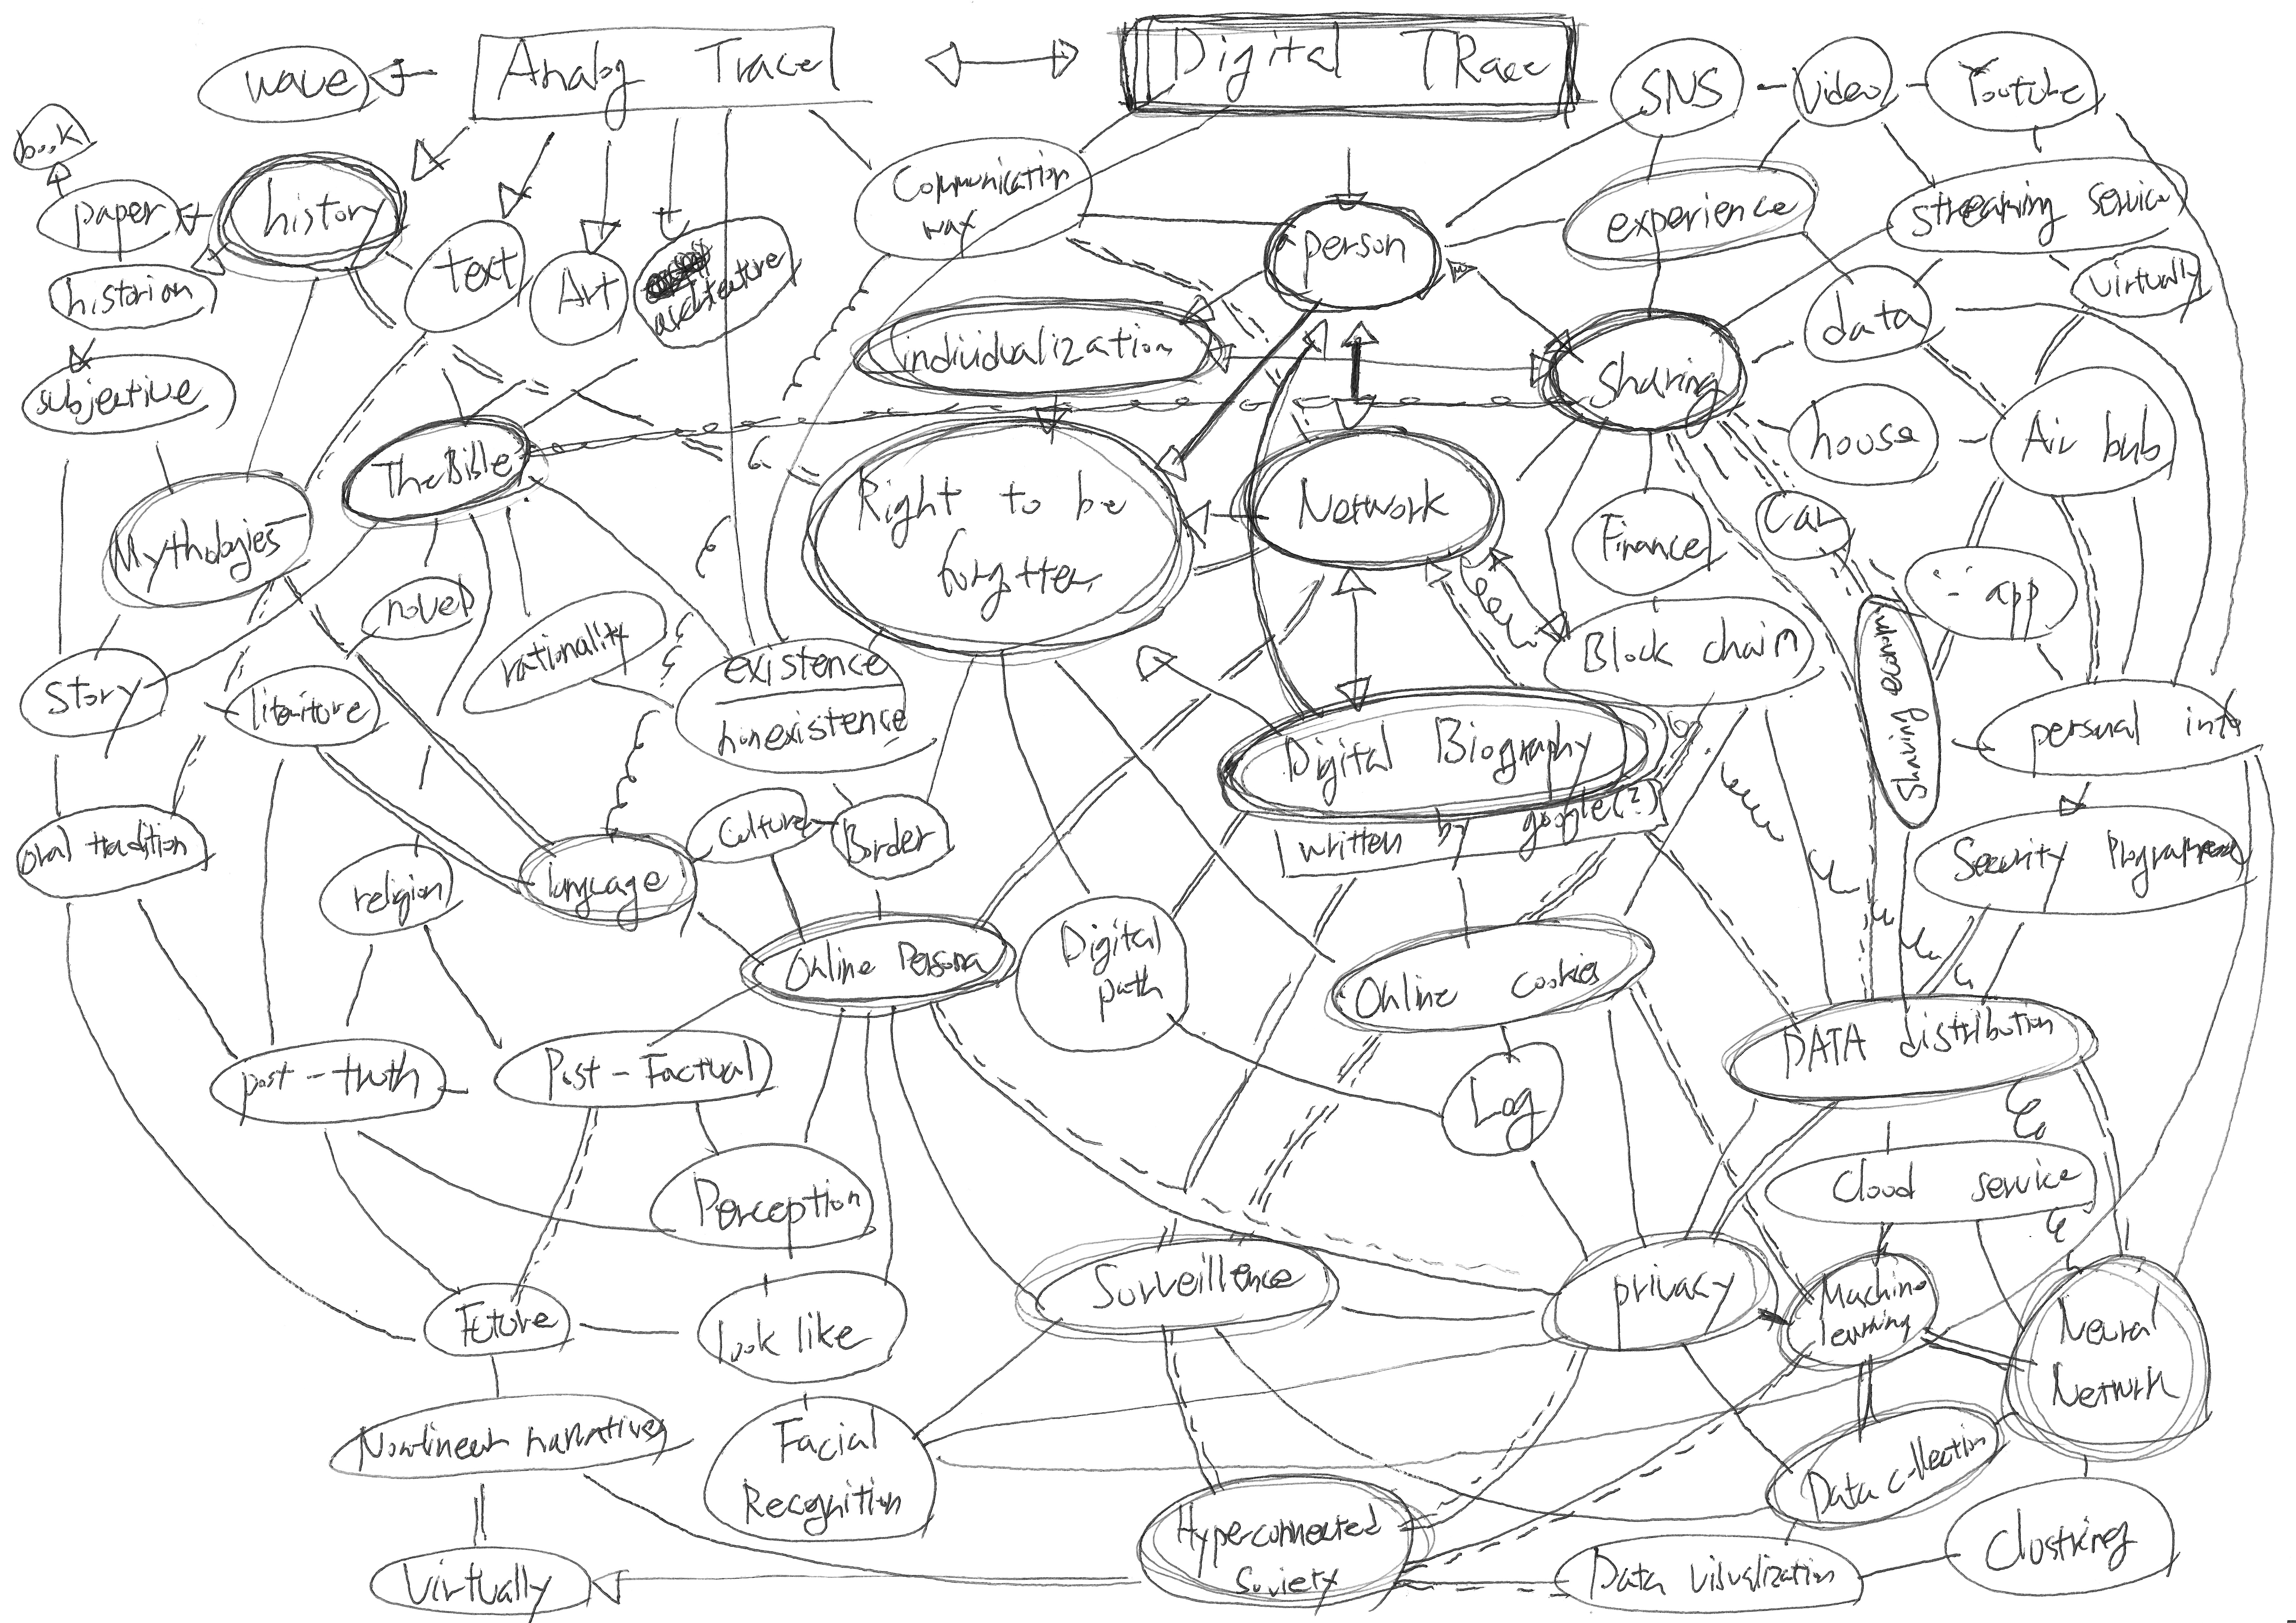
First, I created a mind map to extract ideas.


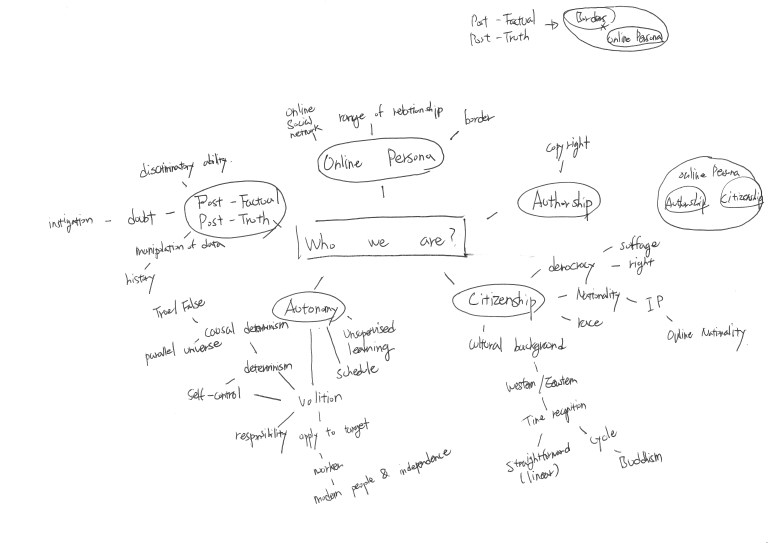

After creating the mind map, the conclusion was ‘data’. In a broad sense, data means that all values with meaningful information are displayed in the form that they are created or processed by a person or an automatic machine. It is a representation of the attributes of an entity, such as numerical values, characters, symbols, etc., obtained from any fact, concept, command or scientific experiment or observation result, or information when specific meaning is given to the data.
In Design Domain Part 1 project, I decided to choose ‘Data’ as the material of ‘How do we live?’ for the discussion in the depth. Because, modern society where we live in now we cannot talk about our life without ‘Data’ and we live in the giant social network. Inside of the network, people collect, consume, produce, and communicate with others through the ‘Data’.
However, the world of network is not directly visible to our eyes. It only exists in numbers and letters. Inside of the network that we do not see, a tremendous amount of data is collected, analyzed, processed and generated every second. This is handled without regard to country, languages, personal and public data.
I am going to focus on personal data collected in the network. For individuals, information such as SNS, e-mail, Internet, and location services will be collected. This wide range of data collection managed by ‘machine learning.

The word “machine learning” is still unfamiliar to us, but we are seeing it in everyday life, and the basic thing about machine learning is prediction. For example, if you enter a search term in a search engine, Machine Learning calculates the search results and even the ads to show. When you buy things or books on Amazon, or watch videos on Netflix, Machine Learning makes the appropriate recommendations for what you would like to see. Our day is with machine running until we wake up in the morning and fall asleep at night.
Machine learning is data based. Data means, in a broad sense, ‘all values with meaningful information’ or ‘displayed in the form that is generated or processed by a person or an automatic device’. Data is a representation of facts, concepts, orders, figures, etc. in numbers, letters, symbols, etc. and It becomes information when a specific meaning is given to the data.
The data itself is merely a fact, but it is used as a material for making information that is used for a specific purpose. Information can be reused as a data for another information, and one of the methods for processing and using such data is machine learning.
Machine learning is one of AI’s approaches. Machine learning-capable machines analyze a large amount of data using complex algorithms to recognize specific patterns and make predictions. In this process, the pattern recognition function of the system corrects errors like human, learns from mistakes, and increases accuracy.

The first great success of Machine Learning was in the financial sector in the late 1980s, which predicted stock price volatility. Since then, attempts to find patterns in large-scale data have been advanced by incorporating statistics into computer science in the 1990s, and machine learning has grown significantly in direct marketing, customer management, credit rating, and accounting fraud until the mid-1990s. In the era of Big Data in 2011, we built a larger system to handle the massive pouring of data and machine learning was quickly recognized as the center of the future economy around the world.
Now, it seems that there are not many fields in which machine learning is not involved in human activities. This growth seems to be great, but it is only a starting level for the future. We should now look what is coming beyond machine learning.
And we are in the midst of another cultural transition in which the computer interface is becoming a vista to another part of reality: ourselves. More specifically, it is our behaviors, habits, actions, fears, and vices becoming visible in a medium that can be accessible to anyone on the internet.
Now, it seems that there are many fields in which machine learning is involved in human activities. Art can not escape the realm of machine learning. In this regard, where do we live? There is a ‘Generative Adversarial Networks’ (GANs) introduced by lecturers called ‘Jen’ during lecture hours. It is a field that is studied intensively recently by learning algorithms without given correct answers.
The study of ‘learning without guidance’ and learning without given ‘correct answer’ is called ‘unsupervised learning’. The longest study in learning unsupervised learning is ‘clustering’ = grouping (grouping) Is a technique that learns the characteristics of data that are not given the correct answer and divides it into similar categories. However, ‘GANs’ differs from simple clustering-based unsupervised learning in that it estimates the probability distribution of the original data and enables the artificial neural network to generate its distribution.
And introduced the work of applying ‘GANs’ to the arts. Which is image synthesis and image conversion framework using ‘Pix2Pix’. Below is a photo attached to help you understand.


In the above pictures, when the user inputs (left image) is received and processed through image compositing or image conversion processing, an arbitrary image such as the above result (right image) is generated. The buildings and things on the right are things that do not exist in the world. It just pulled the left input from thousands of already learned images and recombined them.
Since this year, I decide to apply a basic level of machine learning on the practical project.
Firstly, I create a prototype using an audio file with “Speech – to – Text” API of Google Cloud. And analysis to audio file for lecturer’s speaking and translate to texts. And I used the ‘R’ to visualize the frequency of words spoken with the extracted text. The frequency of the words used varied according to the how do they think about design. The words extracted from this lecture might be of value in the lecturers’ own artwork world.


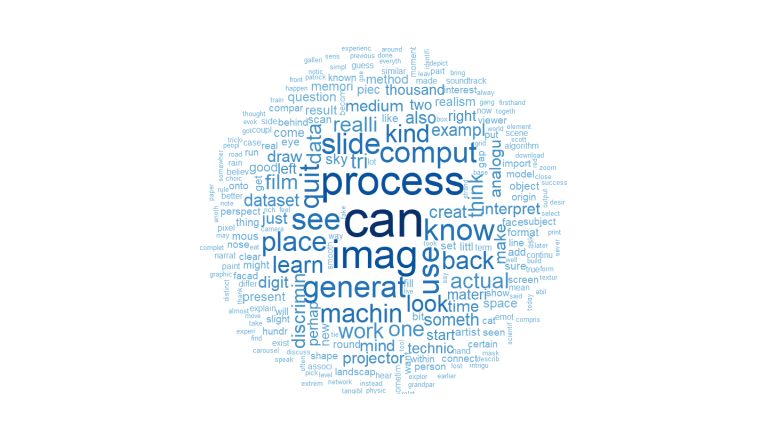
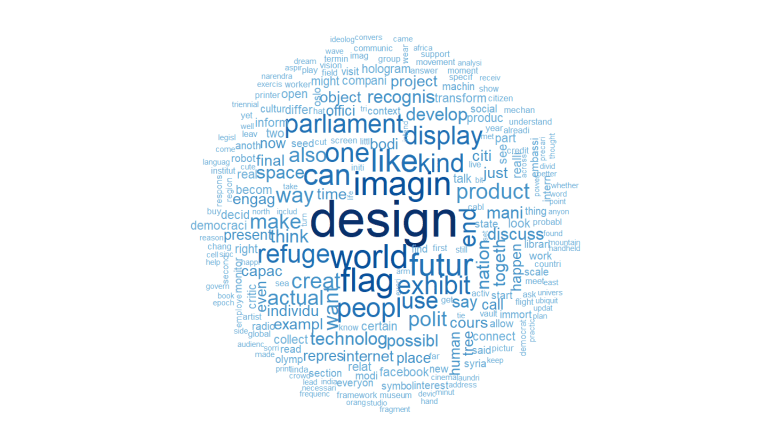
I have summarized what I thought up to this point and talked about it in the tutorial on Tuesday. As I proceeded with the tutorial, I first show that mind map I was made and I said I am going to work with machine learning or data based. And as an example of this, I showed the result of converting voice to text using ‘STT’ and data visualization using “R” based on it.
The evaluation of the tutors was a practical experiment in a short time, and text analysis and data visualization are interesting. However, it is better not to record only the number of words mentioned, but to go a bit further and find a personal or meaningful connection point. And I think it would be good to make the audience feel more than just a simple technology implementation.
Looking back at my work week, I was once again convinced that I had to go beyond technical implementation. I decided to think about the core content of the work a little more. Based on the above feedback, I will go back to the beginning and look back on the subject and approach the topic again.


This is a flow of changes of the times. This is a phenomenon that has appeared as the Internet become a universal in the world. As a result, in the modern society Internet has made to find a lot of knowledge, information, experiences and goods easily. For example, sharing knowledge experience and information through Wikipedia or other forums and SNS, blogs and YouTube. And there is block-chain technology known as distribute record system.
The penetration rate of Internet and smartphones effected on ‘Digital Traces’ and ‘sharing data’. More than half of people in the world use SNS and Internet. They create a personal space on a new platform(SNS) and share their information, photos, thoughts and writings. And this sharing experience on the online leaves a trace of the Internet. A person who you do not know can follow a data related with you on the online. And they can guess who you are.
The ‘Digital Traces’ can be recorded as individual data patterns. Because, individuals have different preferences, interests, and political tendencies. I can say that the person data pattern and identity is equal. Thus, this data pattern can be said to be a self-portrait and identity for people.
If you analyze the ‘Digital Traces’ using by machine learning I mentioned, you can create self-portraits of considerable fun. It might be a link of points or dots on the map, or it might be a chart showing the number of words you used in the article you have written. Or it could be a composite of photos you’ve taken so far, or a log of your Internet and mail records.
I think sometimes that self-portrait visualization can be seen more intuitively when you introduce to other people. I am going to work with the ‘Digital Traces’ of the unique data patterns that individuals have.
After tutorial I tried to make a prototype. First prototype was an animation type work.
Animation depicts everyday life of virtual character ‘A’. ‘A’ depicts a situation in which every day recorded on the online. As ‘A’ wake up, sleeping time is recorded in the Samsung Health App, and if ‘A’ uses the Internet or SNS, ‘A’ data recorded on the internet server.
And ‘A’ uses the card and leave a payment record. Also, location information will be collected while walking around. I wanted to make this kind of work using text and 2D animation formats.


However, with an additional tutorial on Thursday, there was a change of ideas. The tutor informed me that Google’s location information and coordinates can be downloaded as a “json” file.
I thought that it would be more interesting to work with the location record coordinates than the animation work, I decided to turn the direction of the work

The next step for my work is using location information of the timeline service supported by Google Maps. The map shown me a location coordinates that I moved in the past, and that coordinates linked with lines and that drawn unique shapes drawing. That kind of unique Google map line drawing that only one I had in the world.


In order to visualize the movement path in the past to be seen at a time, I downloaded all location coordinates as a file. Inside of the file data, there is only timestampMs, latitudeE7, LongitudeE7, accuracy, altitude, verticalAccuracy were listed. It seems like a garbage number that is not worth at a glance with a simple combination of numbers. but this number contains place and time in the past relate with me.


This location data file values shown from 1 to 3636476. First location data it called ‘3636476’ was recorded on the 31st of October 2012 at 5:55:08.005 GMT+00:00. At that time I was staying in the ‘37.5080161, 127.0973725’ where is South Korea, Seoul.
Last data record in this file is 25st Sep 2018 at 18.12.07.196 GMT+01:00 DST and at that time I was staying in the ‘55.8681217, -4.2616903’ where is GSA Barnes building.
And this data contains how did I moved from place to another place at that time. For example, I used car or public transportation or walking etc.
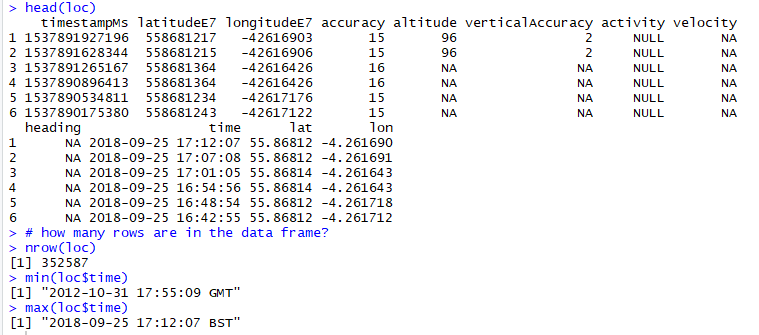


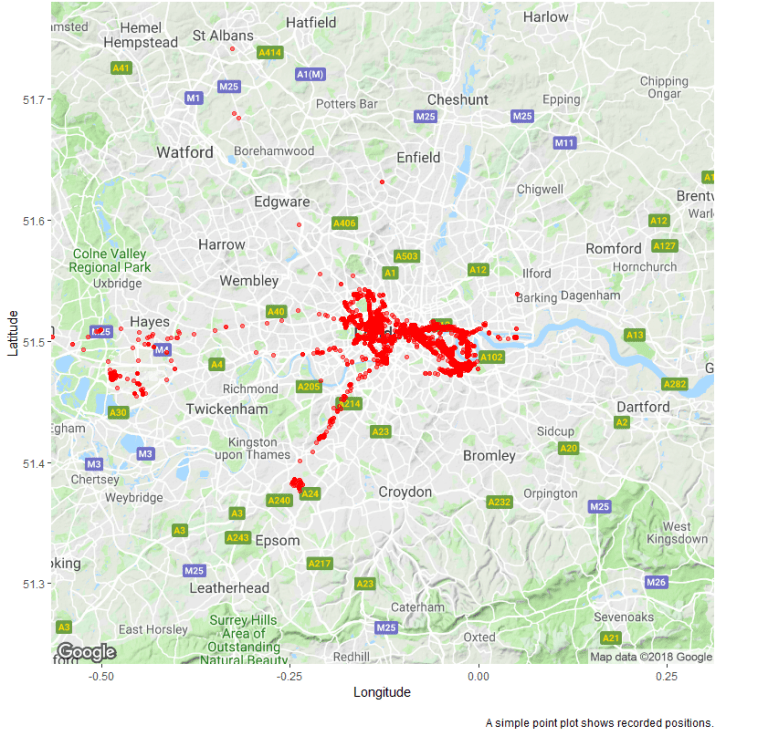

And I try to analyze my location history data using ‘R’. How many days recorded my location data, and reliability of data. As a result of the analysis, there were 352587 positional coordinates recorded during 685 days and recorded distance was 64251.48 km. Then I visualized location data points on the real map.
I will think about how to use my own map as an interactive work in the ‘Design Domain Part 2’ and I think it is necessary to show about “Right to be forgotten” in my work.
(+ In the reality, people are dead, but the Internet logs and online existence of their lives are still floating around. This phenomenon created a new job to erase all the online existence around the Internet after the death of a person. And we call that kind of right is ‘Right to be forgotten’.)
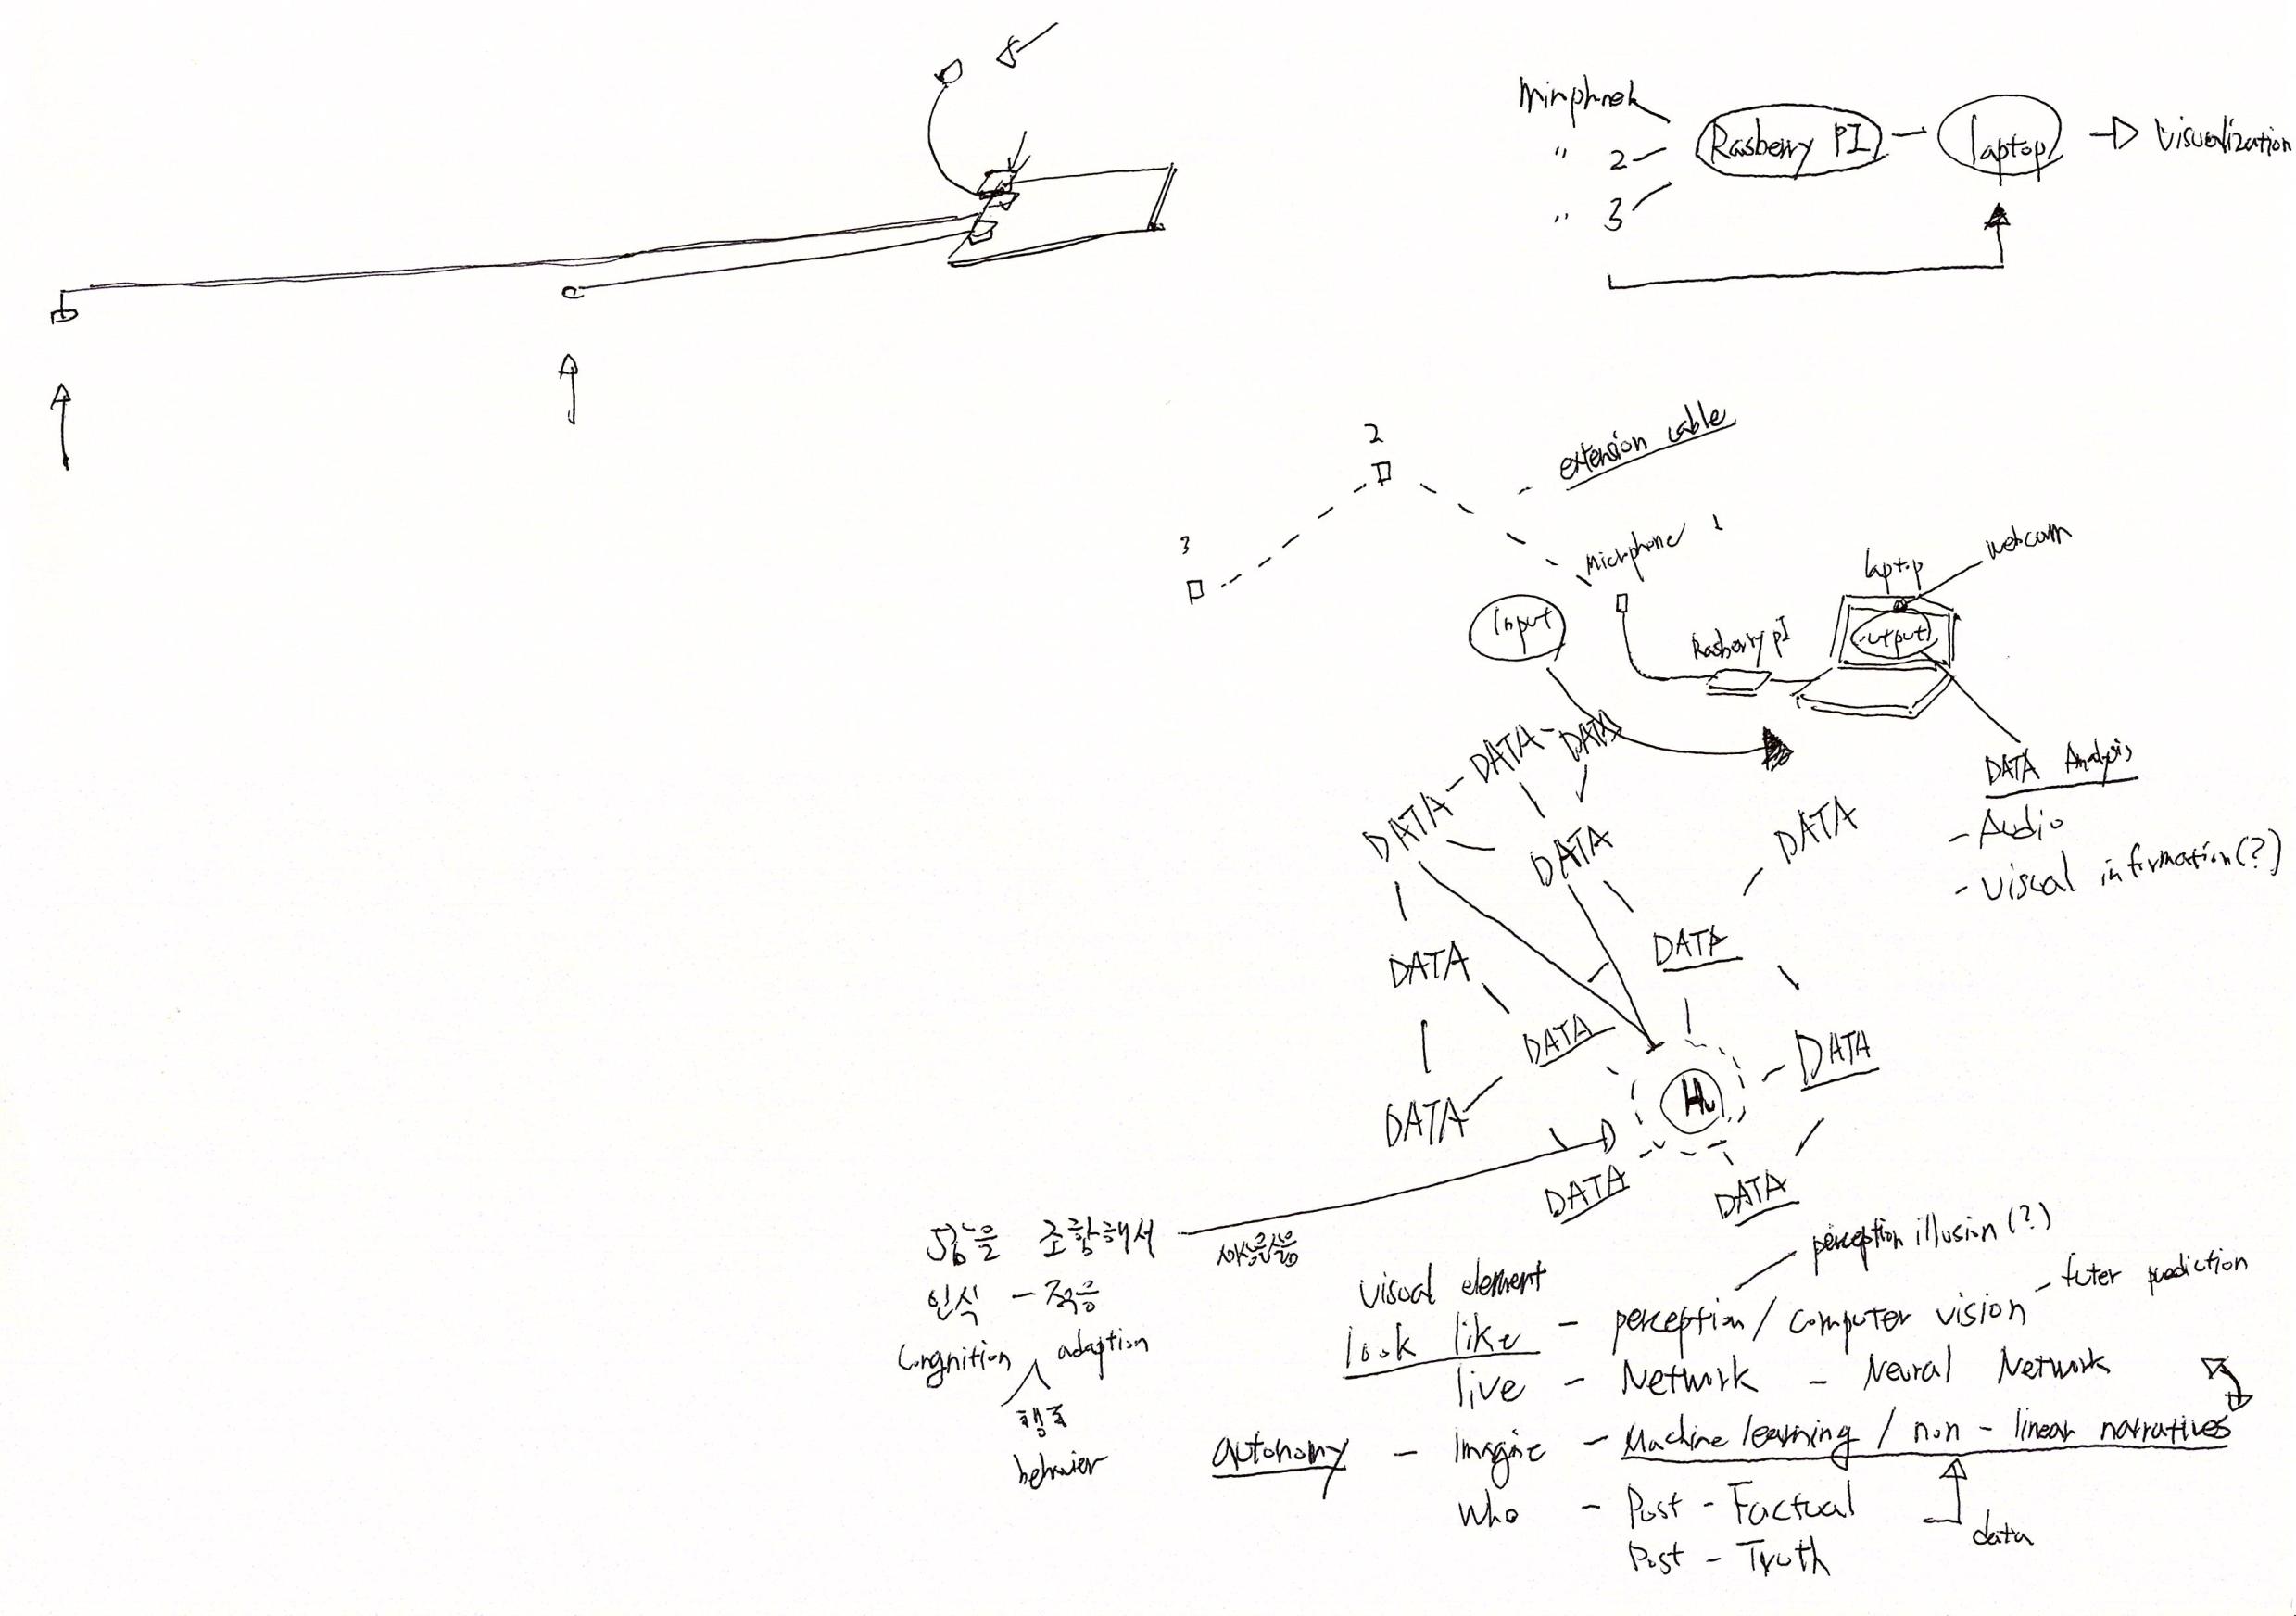
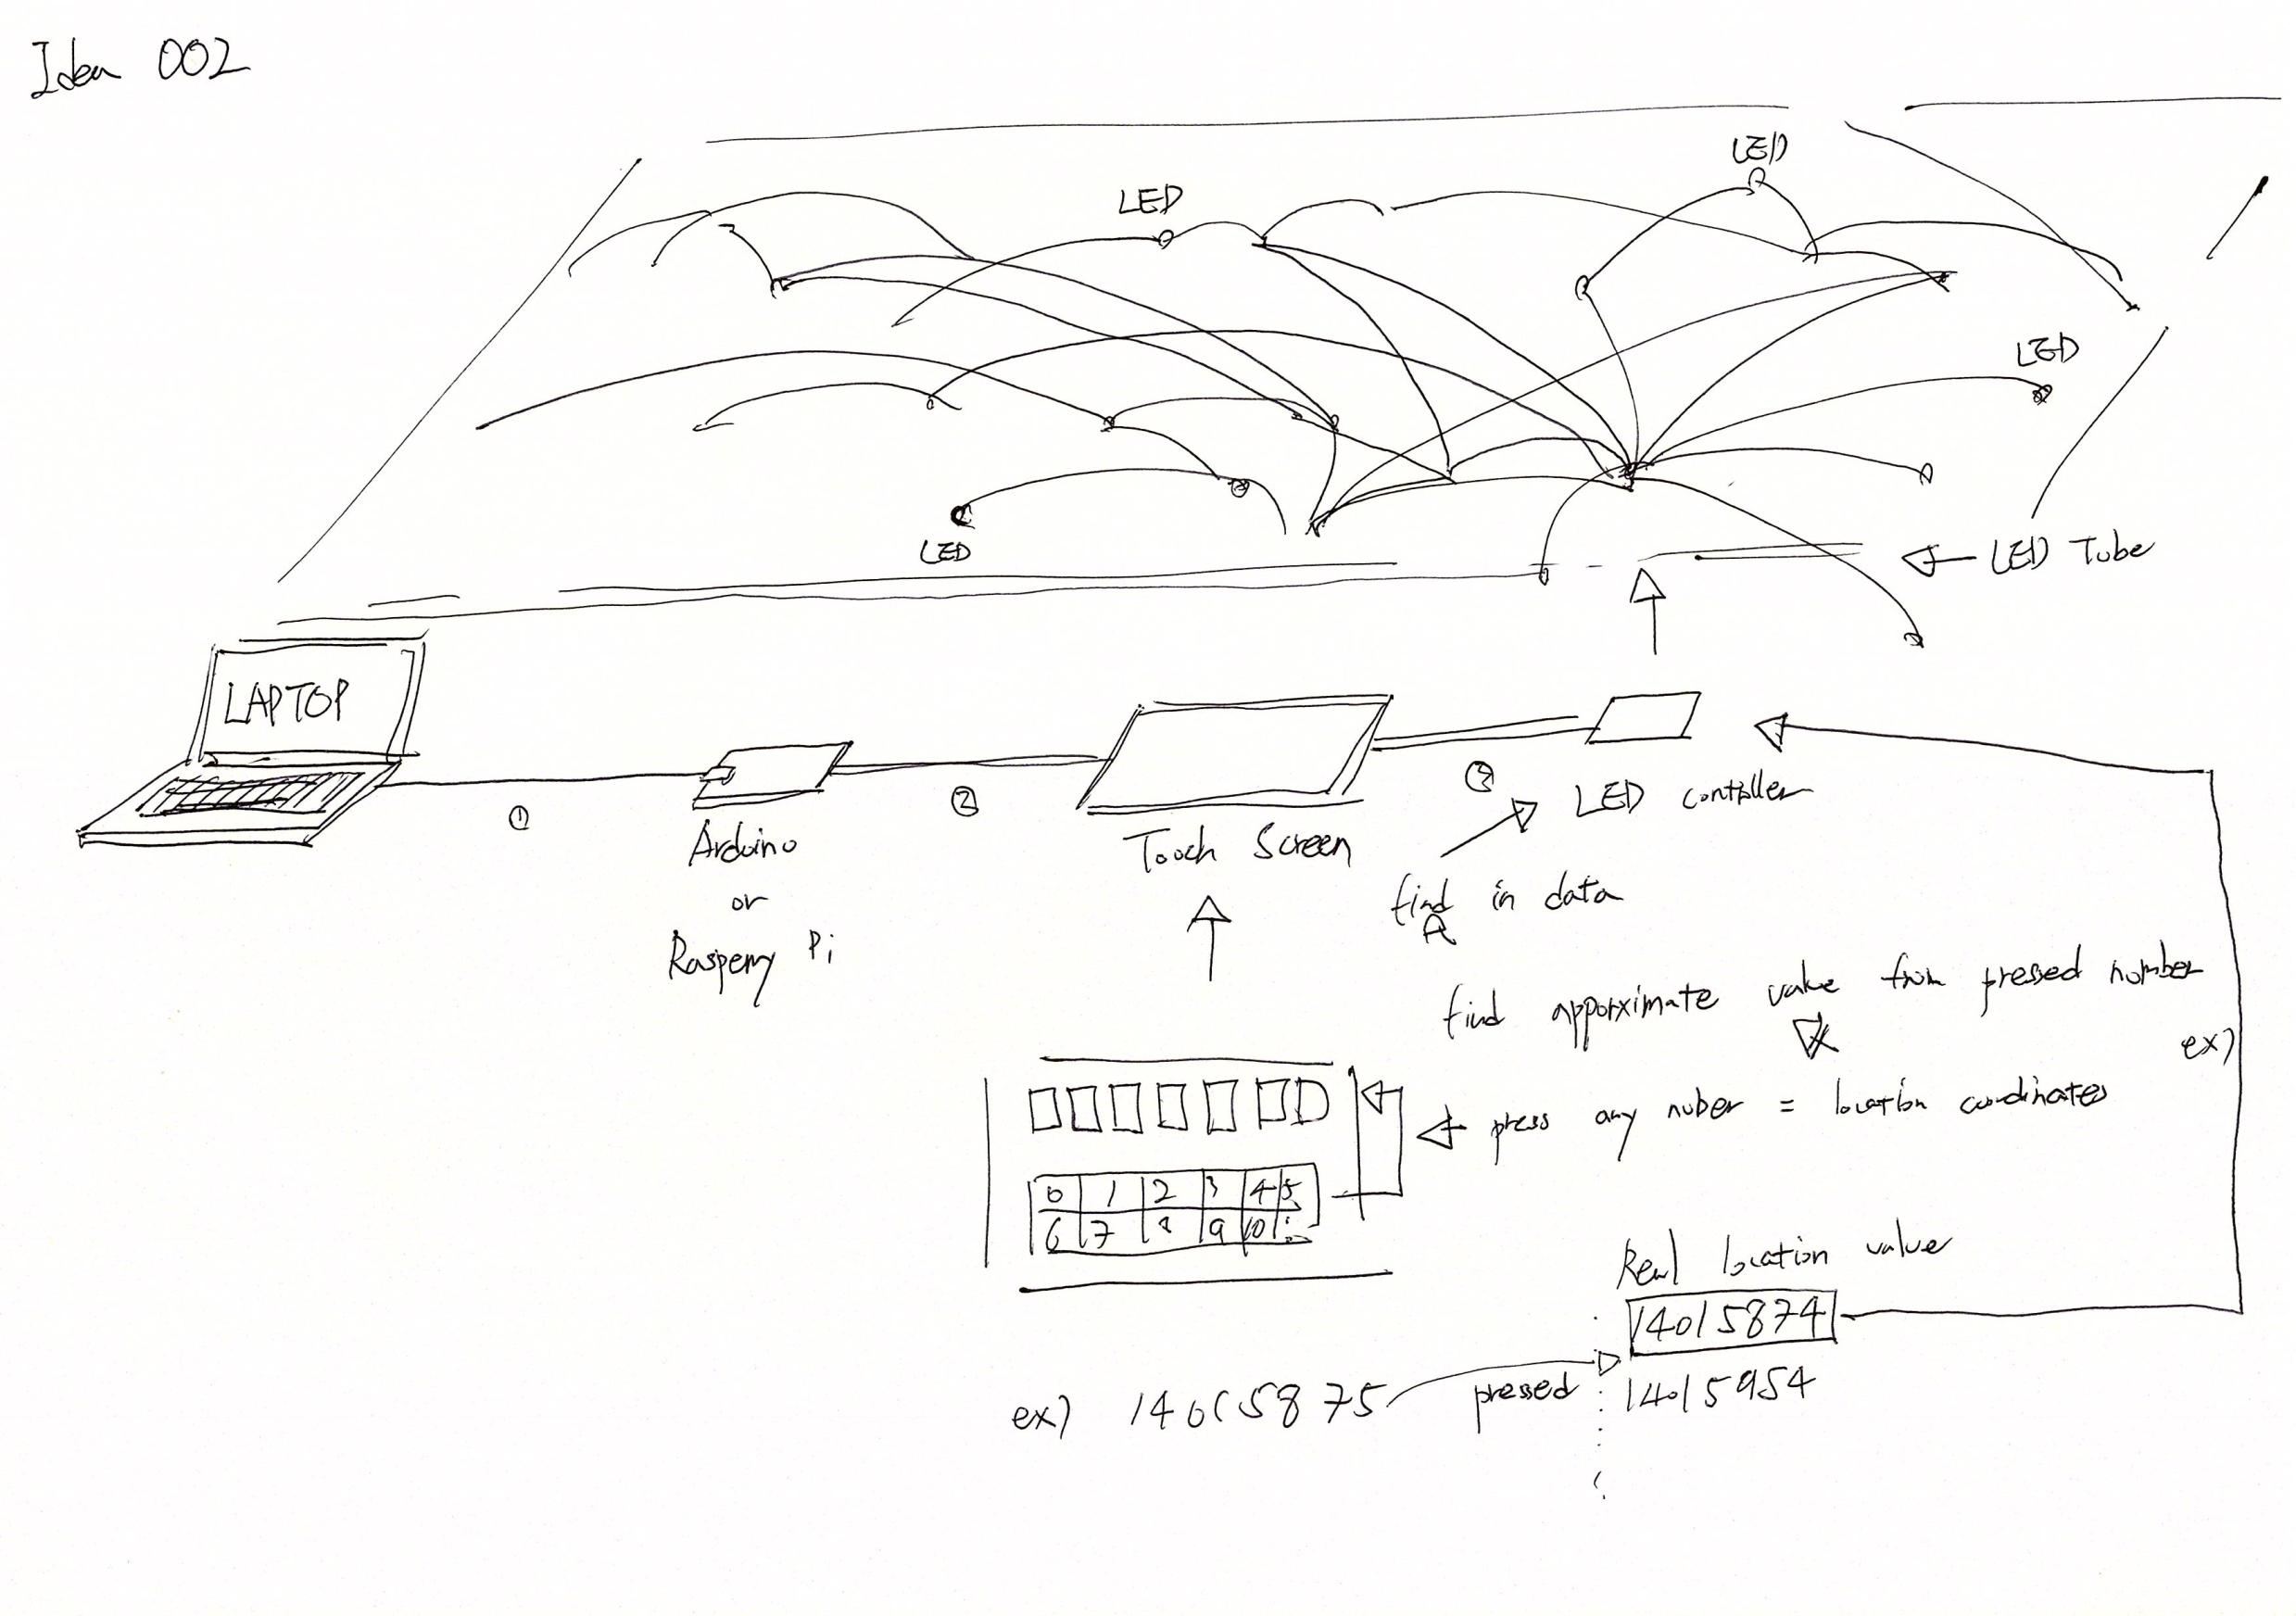
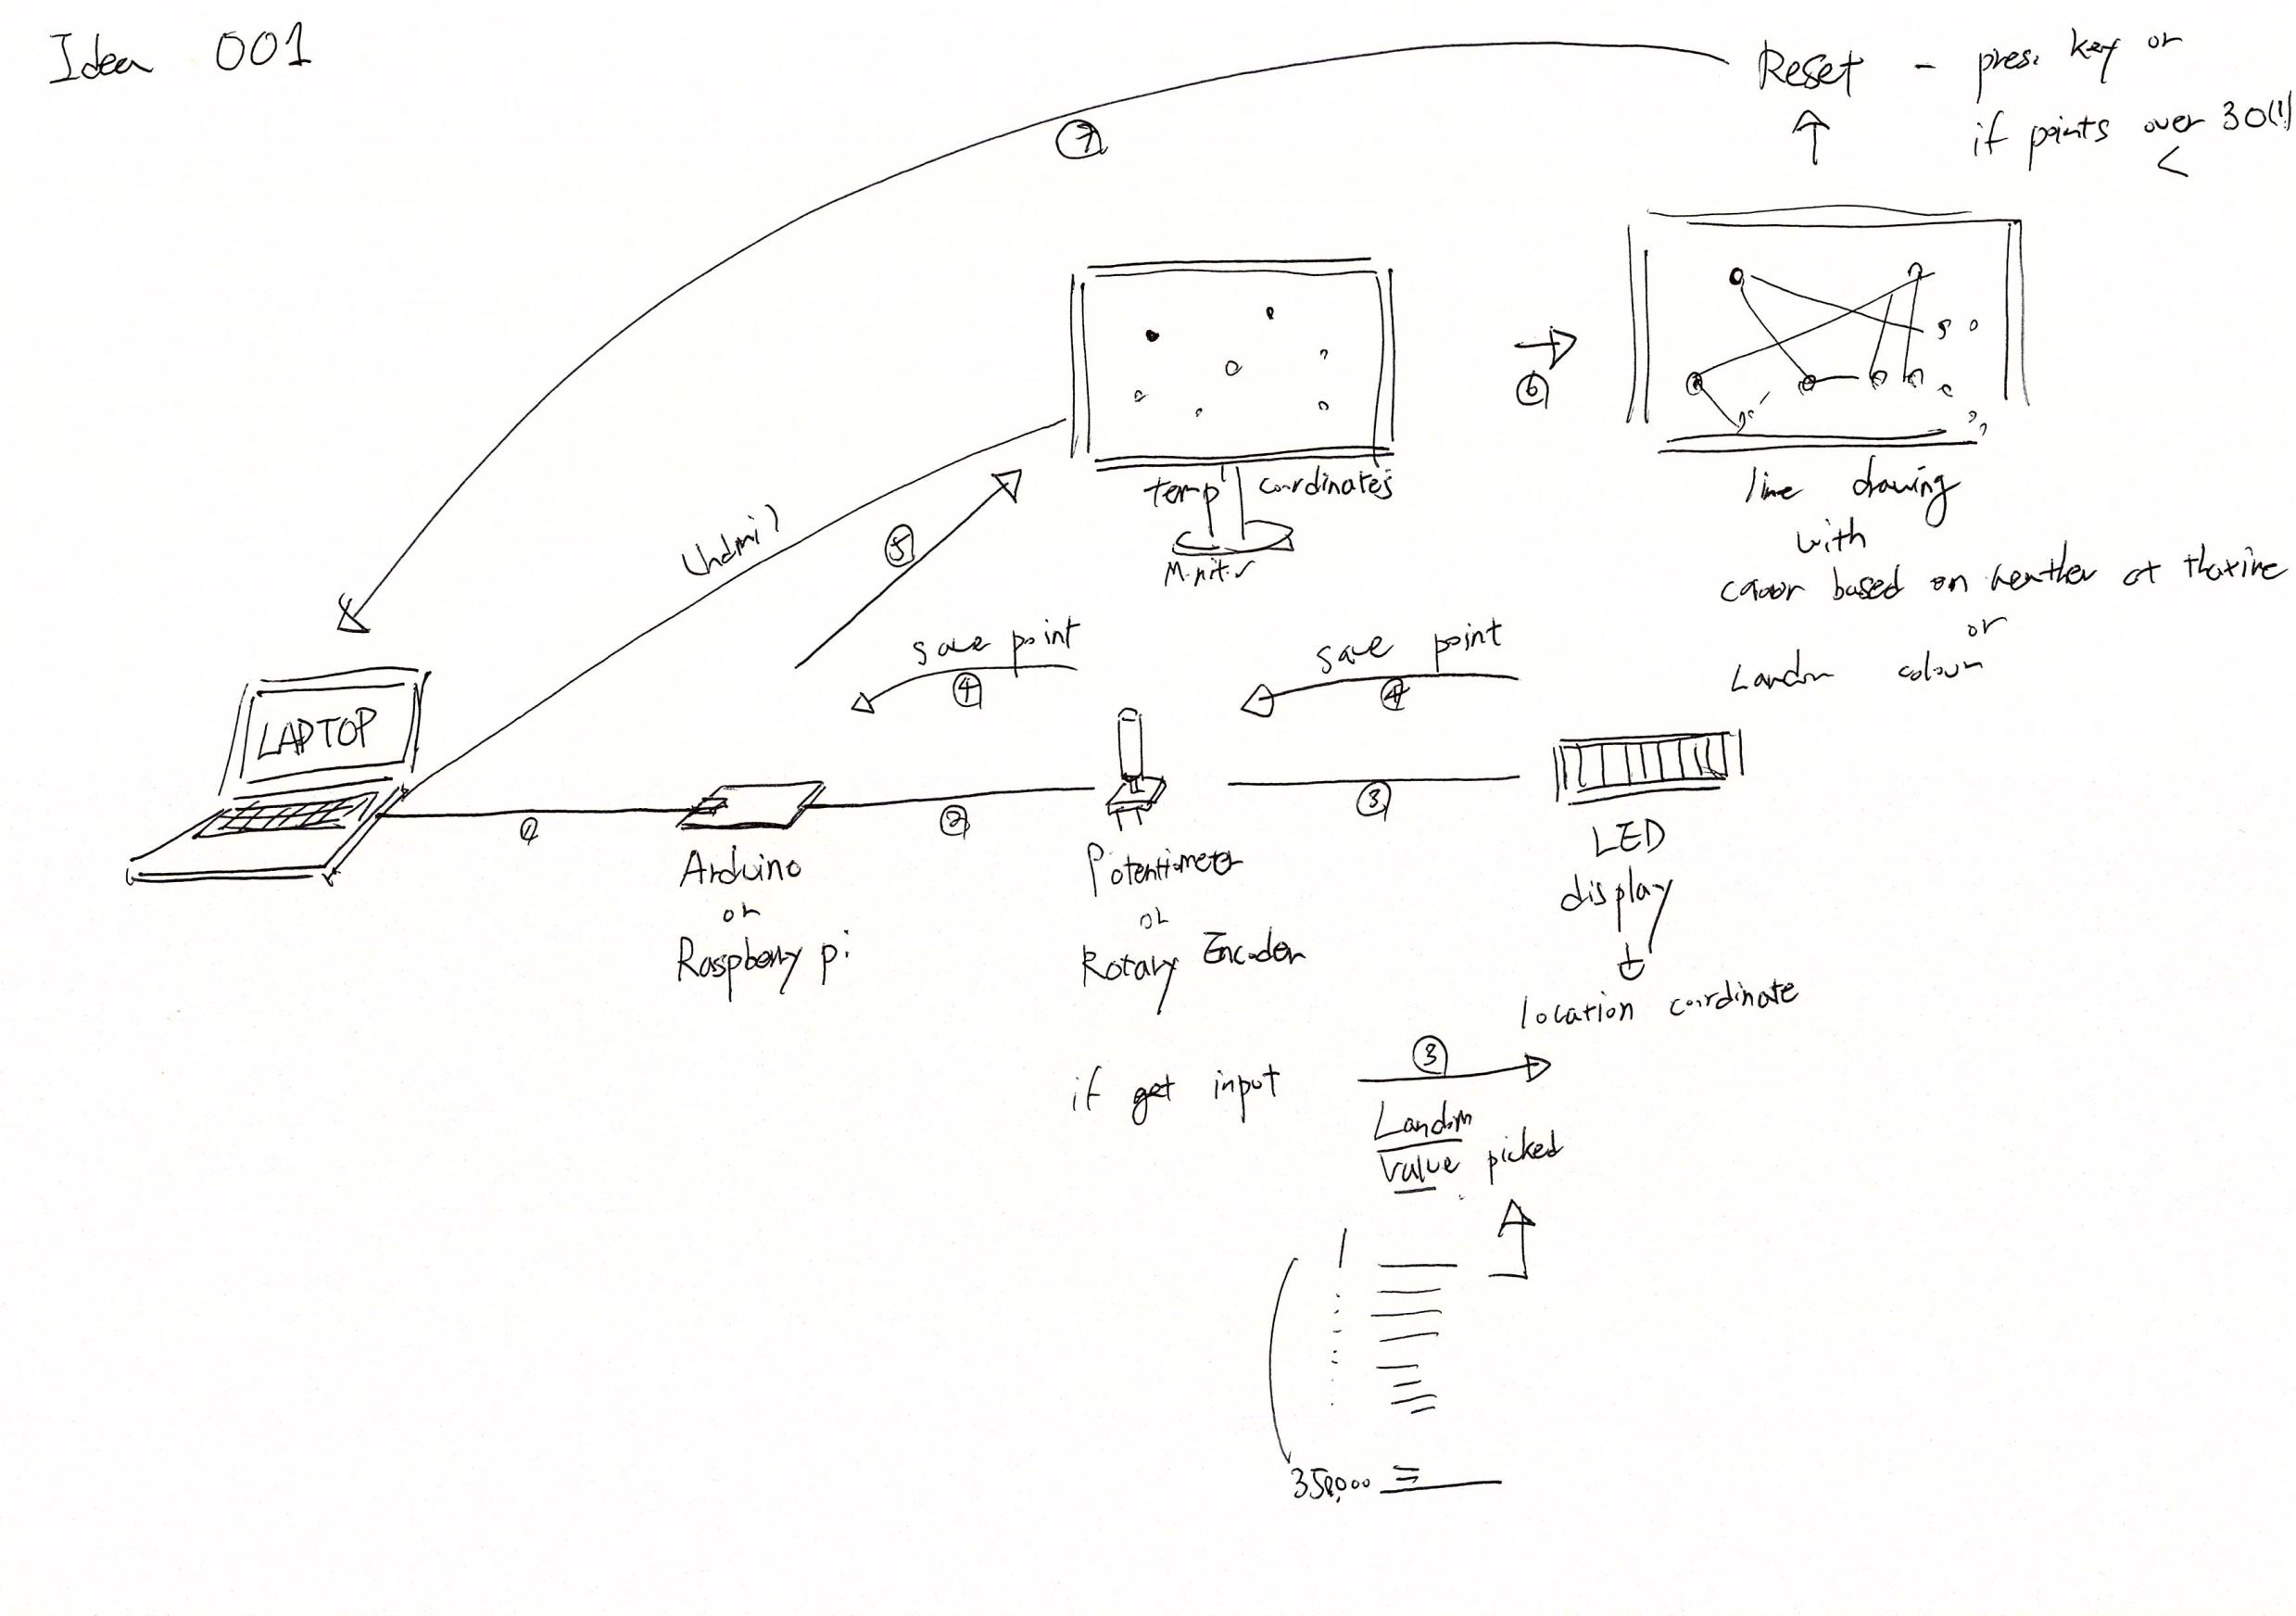
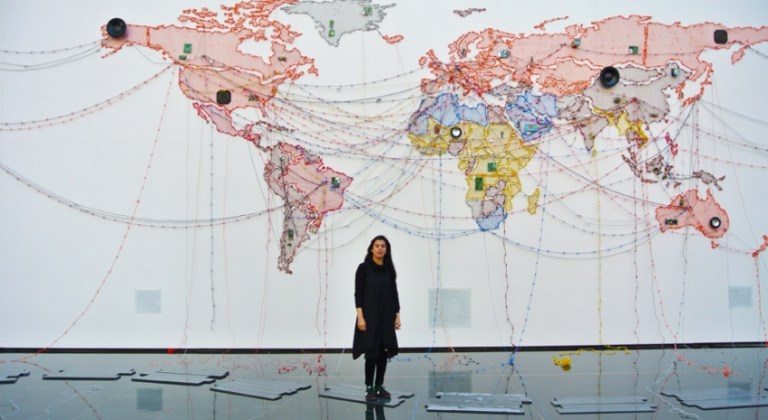
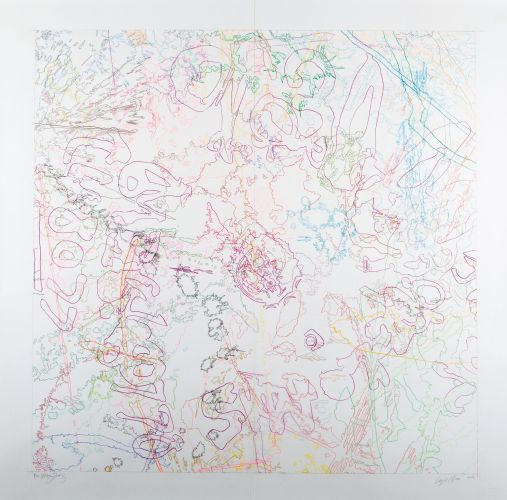
The images and sketches below are the rough directions for the work to be done in the next semester.
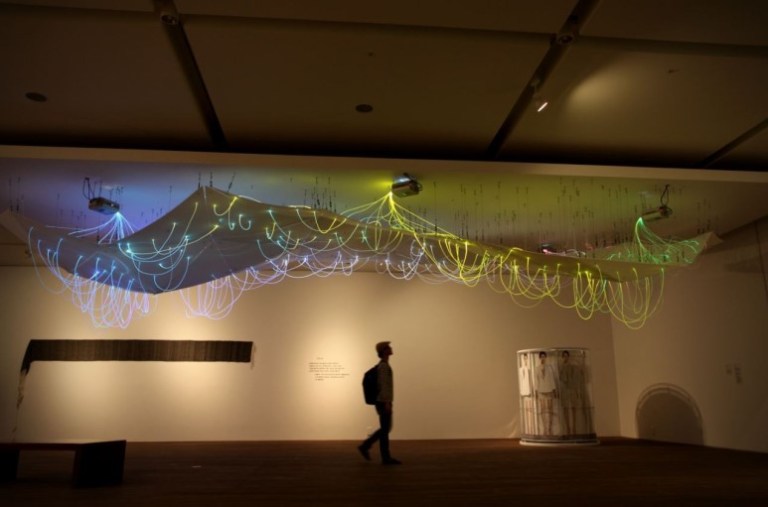
I know that the above work was exhibited at Seoul National University. I wish I could work that way personally, but it is not clear whether it is possible in my ability.


The above is called Nixie Clock, and I thought it would be interesting to visualize the coordinates using this.

The other thing is how to work with ‘GANs’ by making coordinates like line drawing like Google timeline above, but I do not know if it is possible because there are few samples.
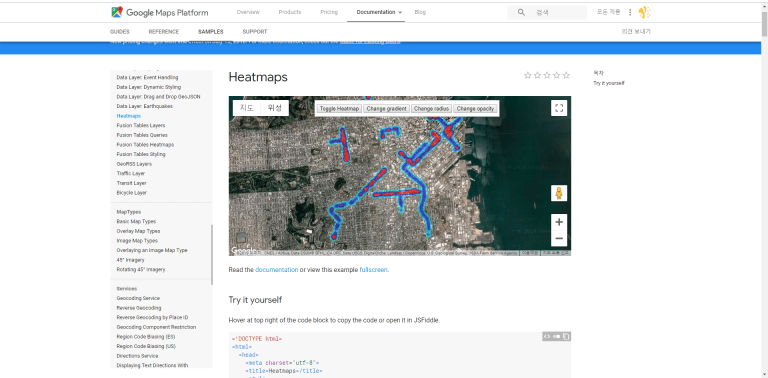


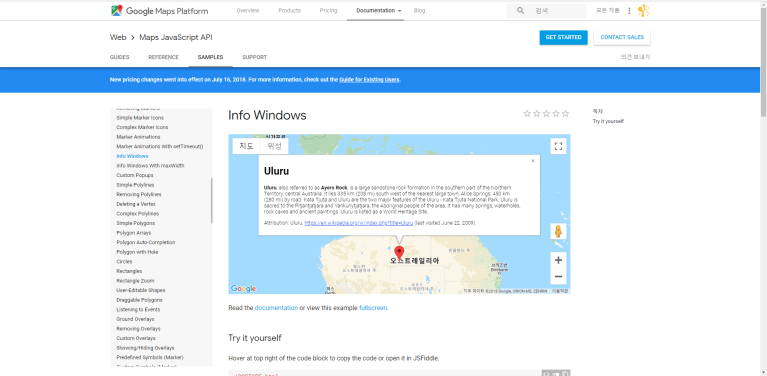

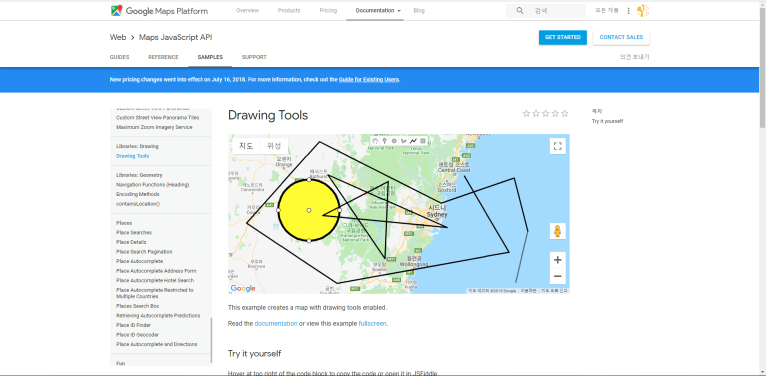
The additional idea is that try to interpretation of the city that I walked with the existing location information using different way. The way of working is using the Google Map JavaScript API, html and p5.js. However, I will work on “traces” by referring to last year’s design domain ideas.
If I look at the Google Maps API examples, I can implement Custom Symbol, Interaction, Info Windows, Heatmaps, and various types of maps. I try to reinterpret the “traces” in the same way as above.
Traces do not exist at present, but they express things that existed in the past. The trace is a ‘niche existence’ between existence and non-existence, and is a medium that connects past and present. These traces scattered in the city are deeply correlated to ‘cultural memories’ and change space into place. Finding and interpreting these traces leads to city reading.
Traces doesn’t have purposes or intentions. They are ambiguous and uncertain, and are discovered and their meaning is created. Meeting with the unintentionally left traces, and memories and recollections that coincidentally work in this encounter is the beginning of reading the traces of urban space. Due to the nature of these traces, various interpretations are possible depending on the observer.
In addition, ‘finding the trace’ is an effort to understand the object, and is a self-reflection of the life that is routinely given. And it is also the expression of ‘love’ about the world where I live ‘life’ now.
I think that designers should pay more attention to everyday urban spaces than to philosophical and theoretical urban spaces that are a little bit distant from our lives. Everydayness is easy to be ignored because they are small and trivial traces. However, cities without everyday life are not colorful and empty. Therefore, it is very important to read everyday traces in a city, which is a public space, and this also leads to interest in their daily life.
There are also ‘historical traces’ in the city. Therefore, the urban space can relate to the individual and collective traces and memories There are several devices in the urban space to protect them. For example, monuments that intentionally preserve memories often give the city an identity. Through them we recall and remember the past. A city with various traces can be described as a kind of “memory store”.
The approach to urban space begins with exploration, which starts with ‘walking’. Walking is a kind of meditation accompanied by physical experience. Therefore, urban space should be able to guarantee walking. Designers should be able to contributes to the process of finding traces(data) accumulated in the city through walking and experiencing new discovery and these lead to the development of the city and the improvement of the life of the public.


Similar to the above works, I am thinking of adding a symbolic or an illustration on the map.
